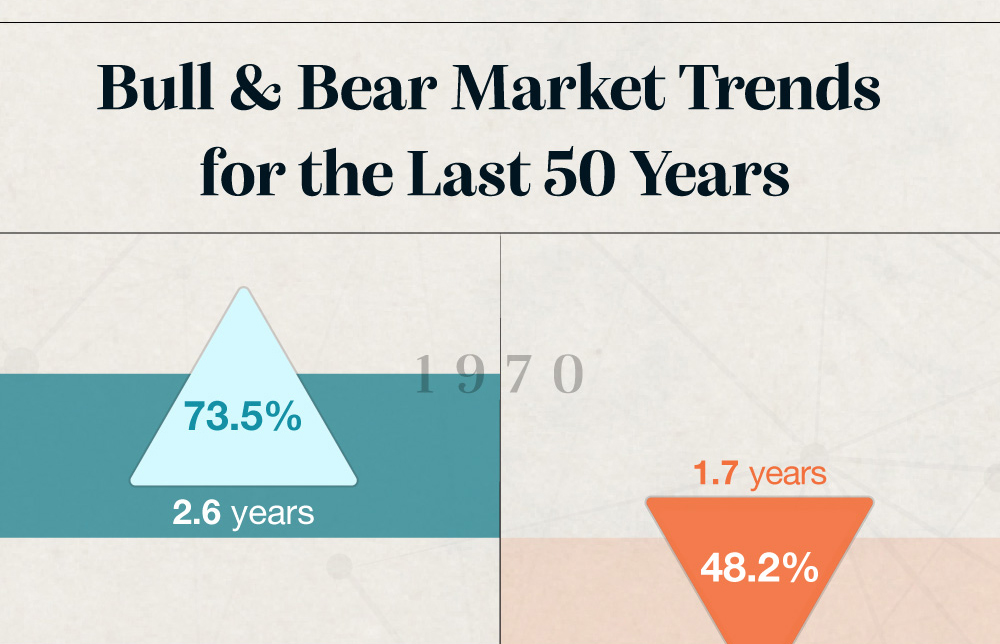
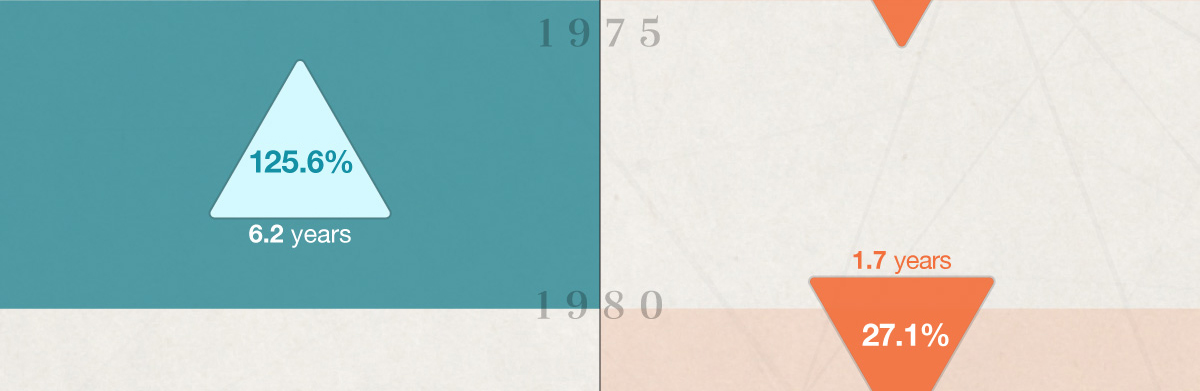
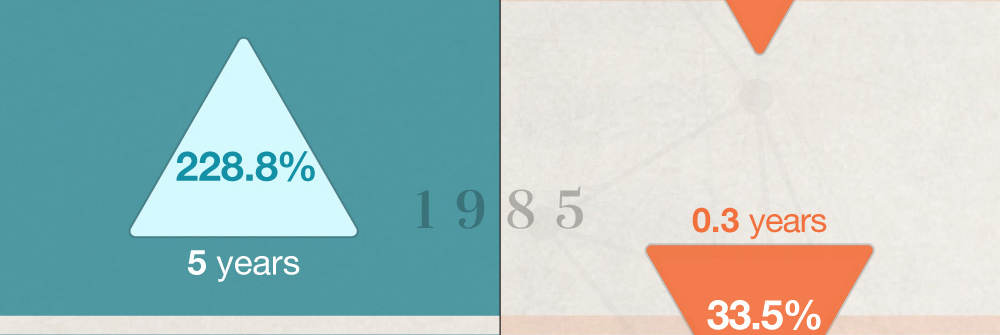
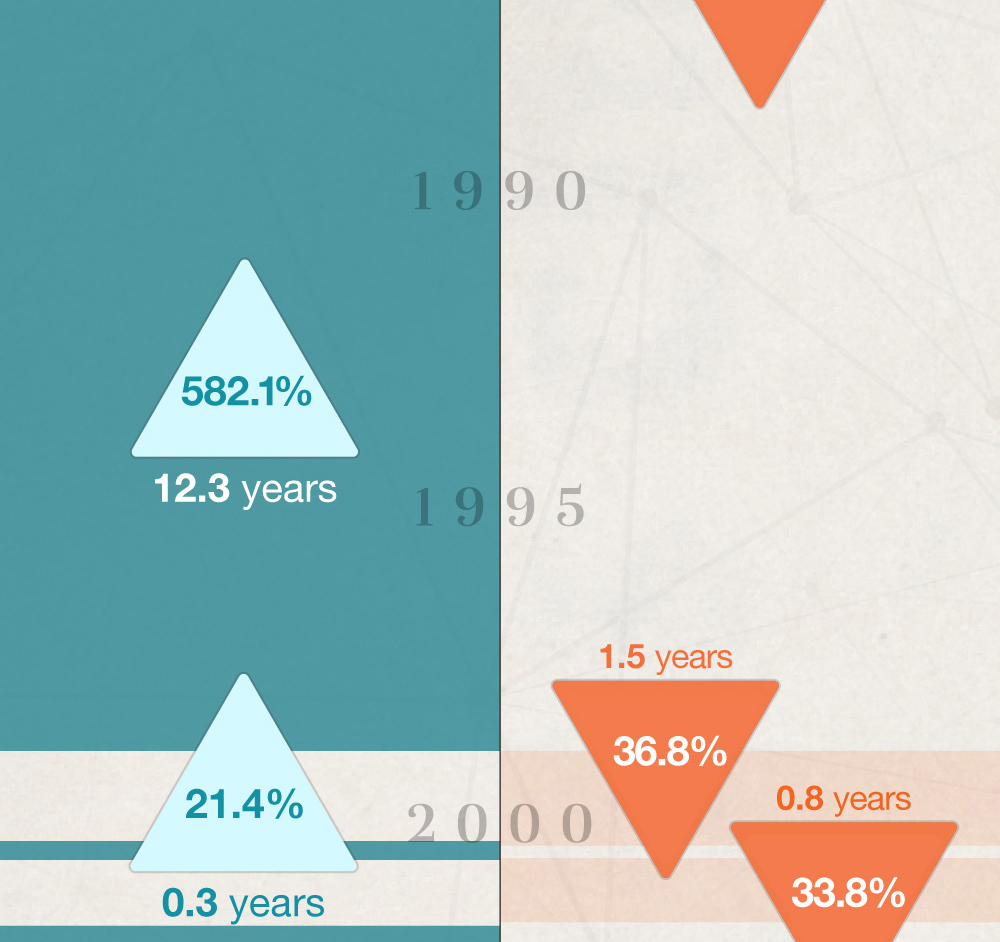
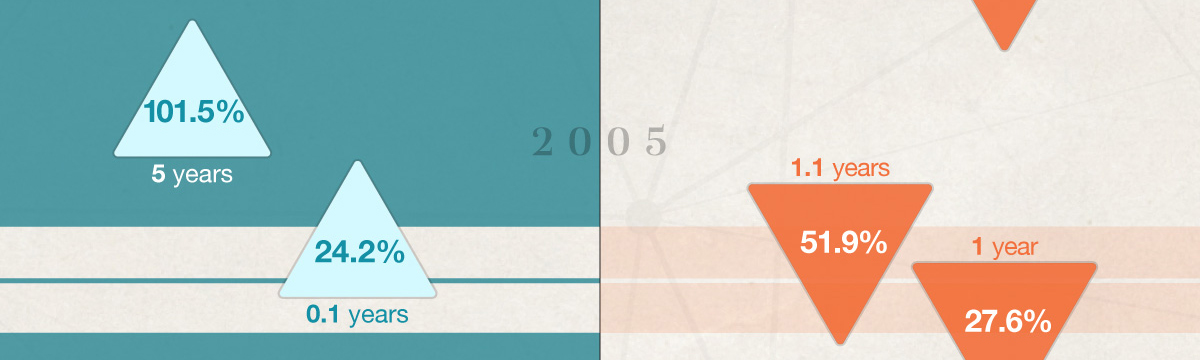
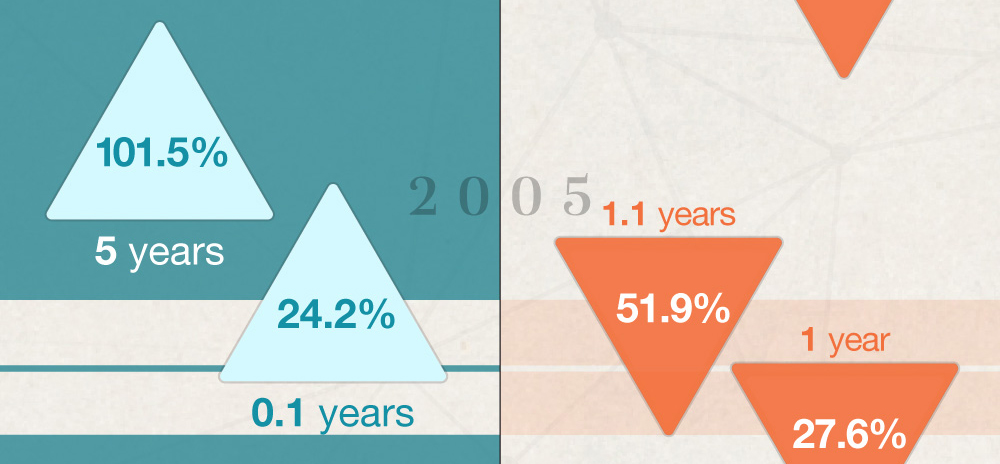
Bull & Bear Markets: A Timeline


It can be difficult for clients to imagine how much they’ll spend in retirement. This short, insightful article is useful.
Executors can value the estate on the date of death, or on its six-month anniversary —the “Alternate Valuation Date."
If your clients are buying or selling a home, use this to help them determine if they qualify for capital gains taxes.
Five phases to changing unhealthy behaviors.
Help small businesses make better retirement decisions for employees with this eye-catching and informative infographic.
Planning for children with special needs can be confusing but by working together, we can help navigate those challenges.
Estimate how much home may fit within your budget based on income and expenses.
Compare different mortgage term lengths side by side to find the option that fits your budget.
See how long a lump sum of savings could last based on your withdrawal rate and return.
A visit to the hospital can be painful, for both your body and your wallet. Don't let it be more painful than it has to be.
It’s never a bad time to speak with your financial professional about changes in your situation.
Ready for retirement? Find out why many are considering encore careers and push your boundaries into something more, here.